Intro to Analysis Tools:
Analysis Tools and Toolboxes
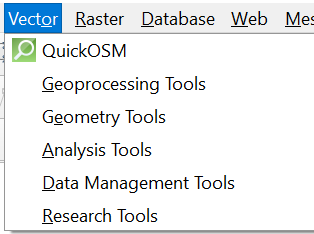
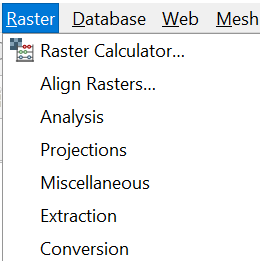
Many of the most frequently used tools are available from the main menu under Vector and Raster:
Vector tools:
Raster tools:
But many more tools are available in the Processing Toolbox. To open the Processing Toolbox, click the button that looks like a cogwheel in the menu: 
Here you can view all the available tools, your processing history, and recently used tools:
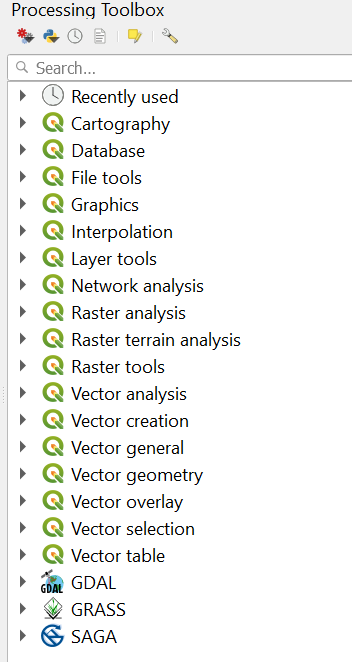
An advantage to using QGIS is that other open source geospatial libraries are available as tools as well, such as GRASS or GDAL processing tools.
Example Vector Analysis
Count Points In Polygon (aka Summarize Within or Spatial Join)
Let’s say you wanted to know how many points fall within a polygon. For example, hospitals within a search radius, or McDonalds per county. We can achieve this using the Count Points In Polygon tool.
In this example, we’ll sum the number of cities within counties.
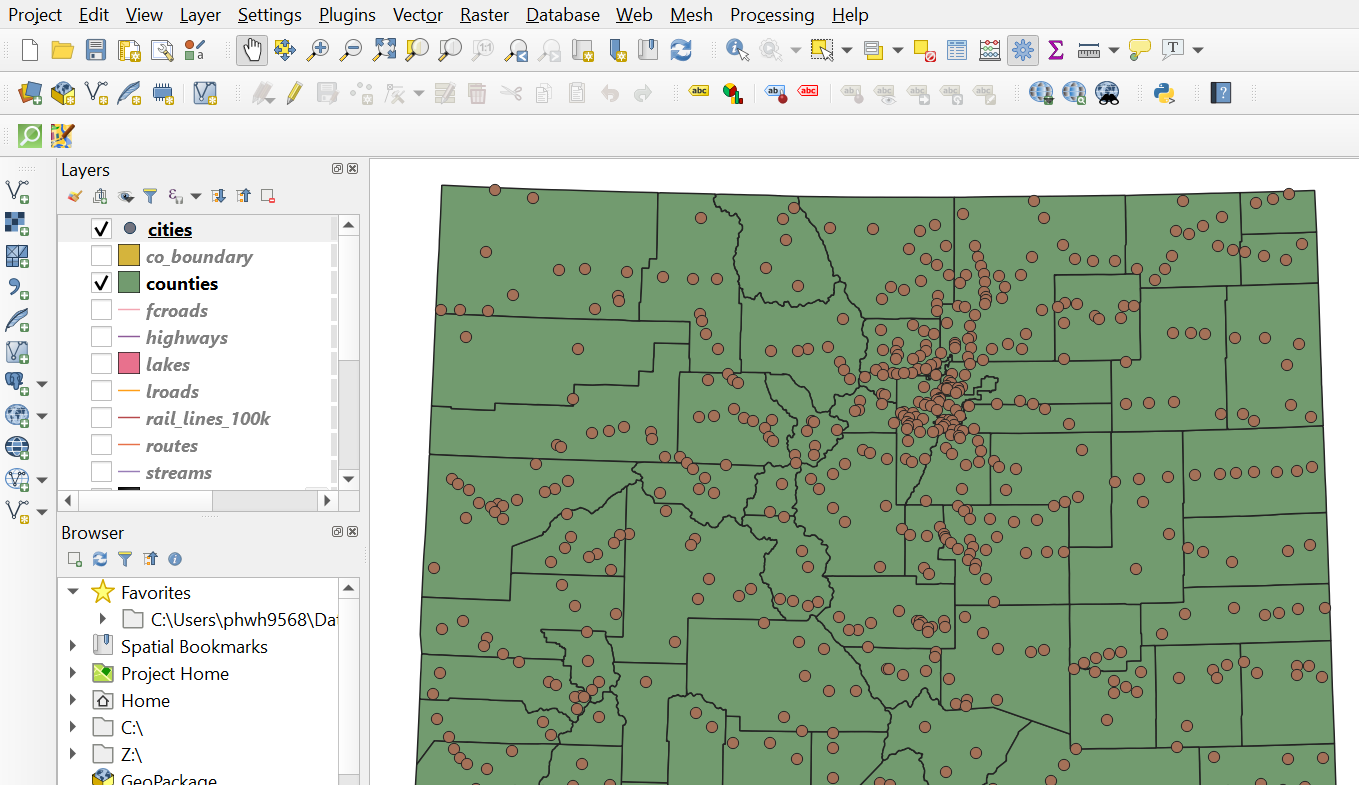
- Under Vector, choose Analysis > Count Points In Polygon:
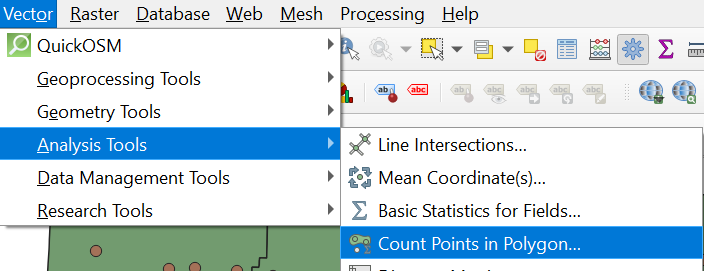
- In the Count Points in Polygon dialog box, choose counties under Polygons and cities under points. In this example, leave all other options as default. This will produce a temporary, “scratch” layer that can be made permanent later.
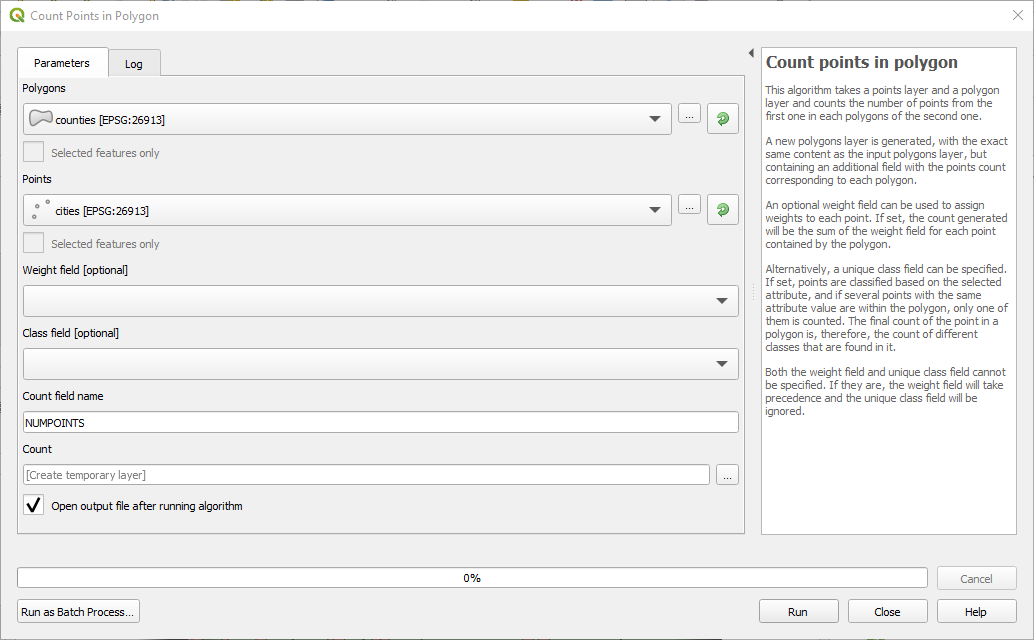
Note how fast that process ran!! Better than ArcGIS, for sure!
- The tool produced a new temporary counties layer named “Count”. Right click on the new “Count” layer to open the attribute table. You will find a new data field containing the sum of cities within each county. Easy!
To make this layer permanent, right click on the layer and select Make Permanent.
Example Raster Analysis
Create a Quick Hillshade Layers
-
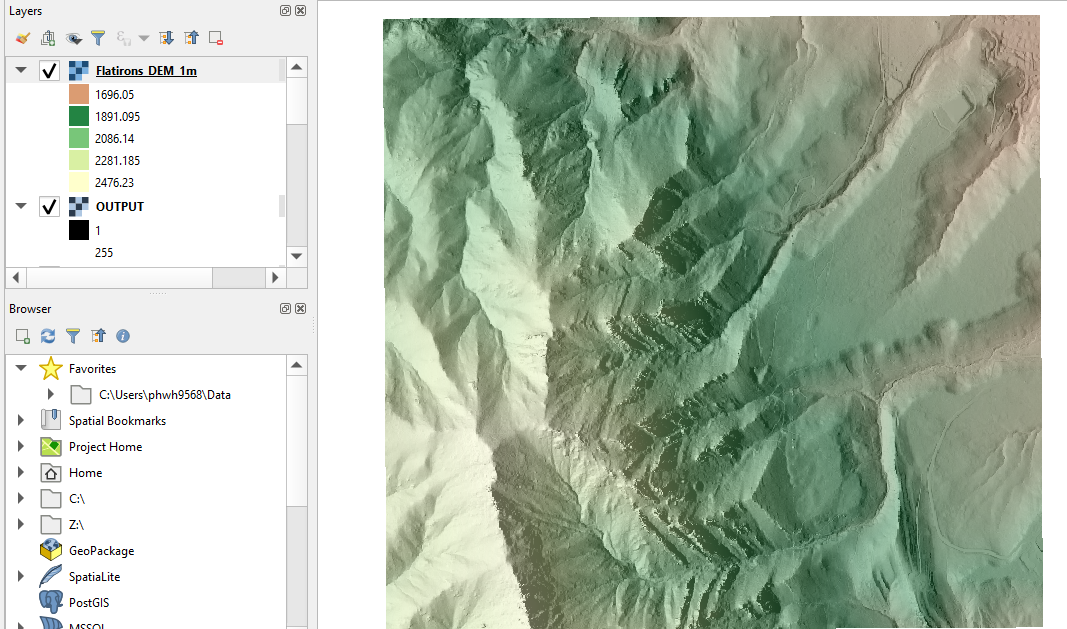
Add the Flatirons_DEM_1m geotiff file from the workshop data folder.
-
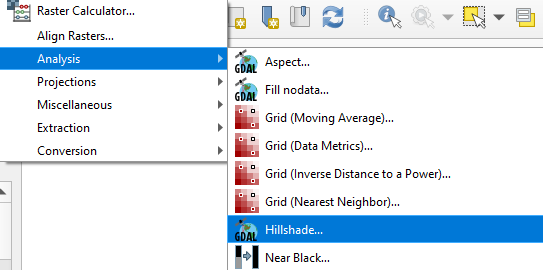
In the Raster menu, choose Analysis > Hillshade. Note this is a GDAL tool.
-In the Hillshade dialog box, you can leave all parameters as default (but feel free to tinker with azimuth and altitude settings for different effects).
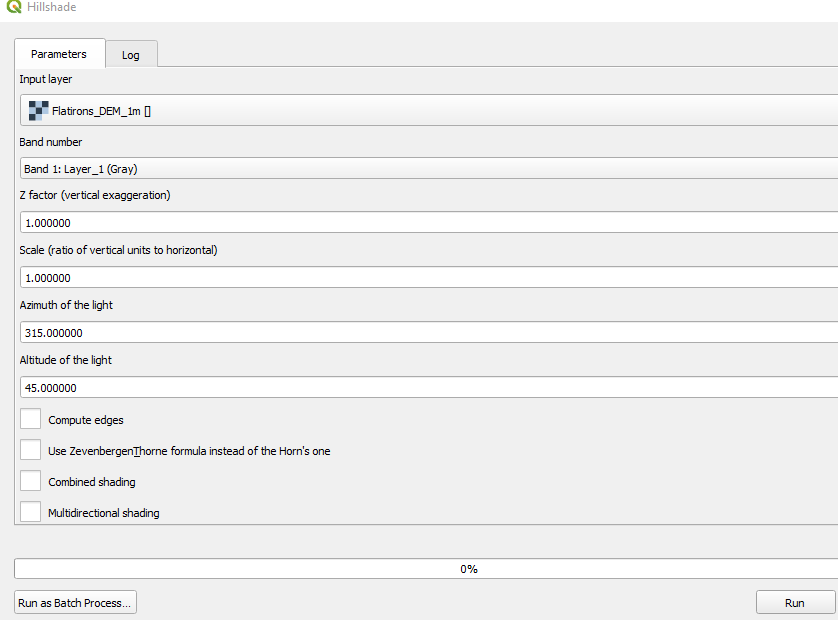
You’re resulting hillshade raster will be added to the map. To make the hillshade a permanent image, right click the layer and choose Export > Save As…
Spend a few minutes tinkering with hillshade parameters as well as styling of the original DEM (color ramps, transparency, etc.) to make something pleasing.
Pro Tip: For folks familiar with ArcGIS and looking for equivalent tools, often the best strategy is to search for the tool name as you know it in ArcGIS along with “QGIS” [Example: “Summary Statistics QGIS”]. This will usually yield good results. If you can’t find a tool for a particular task in the QGIS tools, check other tool libraries like GRASS, GDAL, or SAGA, or search the Plugin Repository.