Styling and Symbolizing Data:
Quick, single-symbol styling:
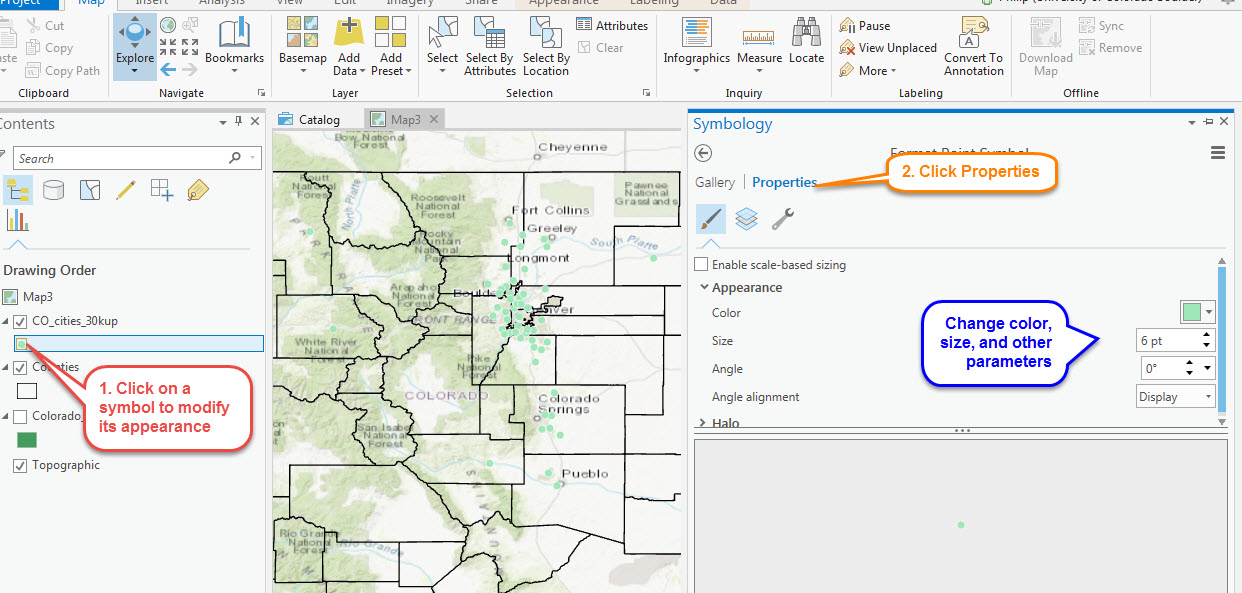
- Start by double-clicking a layer’s symbol.
- Use the Symbol Selector to change a layer’s appearance:

Advanced:
- Add the Counties layer from the workshop geodatabase.
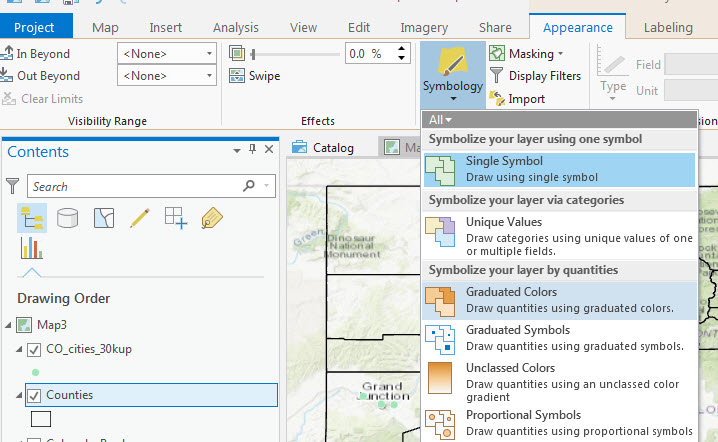
- Select the Counties Layer
-
On the Appearance tab, select an option for styling, such as by unique values or graduated colors

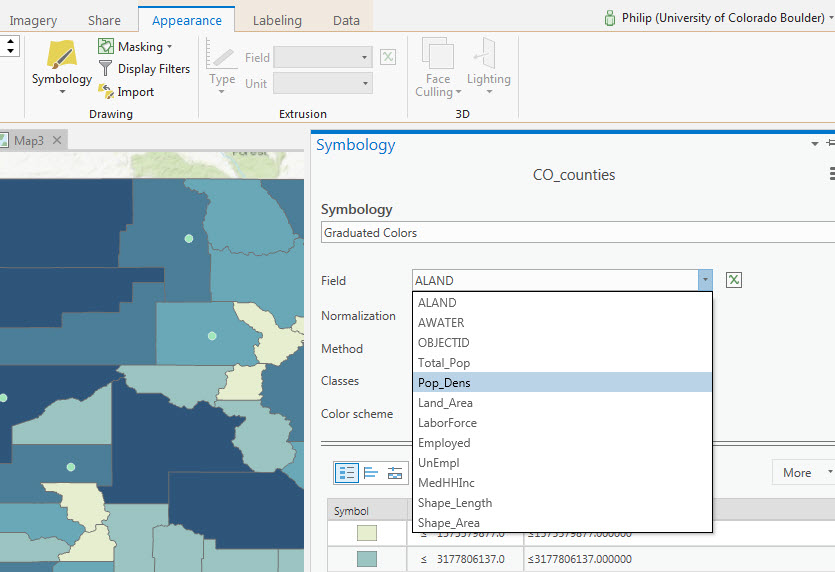
- Under Fields, select Pop_Dens from the Value menu (this corresponds with the Pop_Dens field in the attribute table)
-
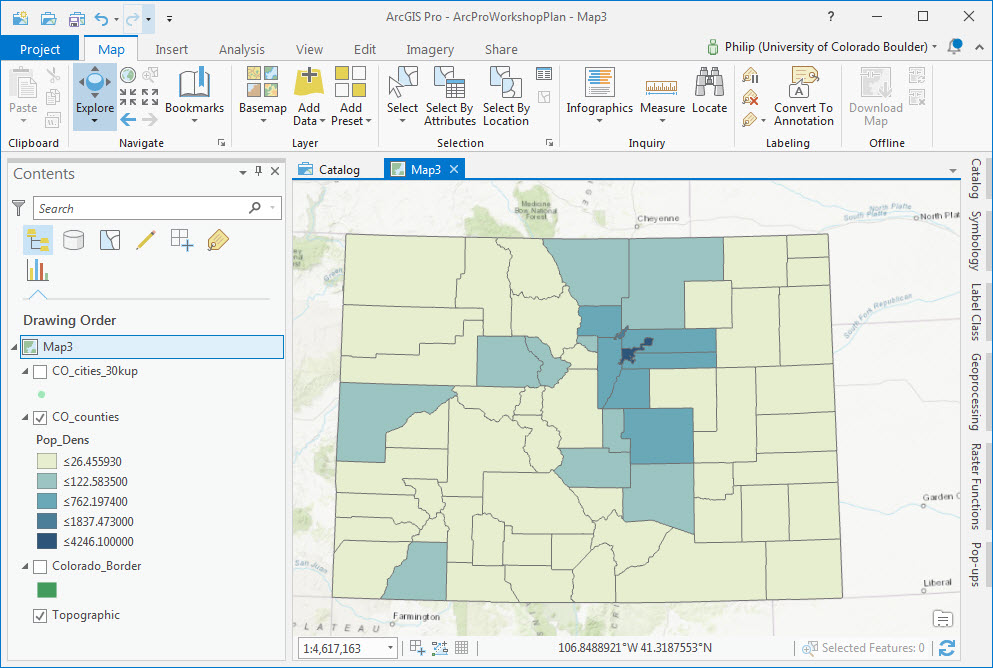
Ta da! You’ve made a choropleth map that shows population density. Hurrah!

Changing the displayed projection
You may want to change the projection of your map for stylistic purposes
- Right click on Map in the Contents pane & scroll to properties
- Click the Coordinate Systems tab
- Search or scroll to find an appropriate projection for Colorado
Note: this only changes the display of your map, not the underlying coordinate system of your data layers
